Hey everyone! TM here from EarthScene. Today I’m really excited to share something I’ve been developing that could fundamentally change how we collect, process, and utilize environmental data. I’m calling it the EarthScene Index (ESI), and it’s the core technology that powers our platform’s unique capabilities.
The ESI started as a solution to a problem I kept running into while building our microclimate visualization system: how do you make sense of environmental data that comes from dozens of different sources, in different formats, with varying levels of accuracy, and different update frequencies? Traditional approaches either sacrifice accuracy for consistency or require massive computing resources that aren’t practical for a startup.

What Makes the EarthScene Index Different?
After months of research and experimentation, I realized we needed an entirely new approach. The ESI isn’t just another environmental data aggregator — it’s a dynamic, self-improving system that creates what I call a “living mesh” of environmental intelligence.
Here’s what makes it special:
1. Dynamic Source Weighting
The ESI doesn’t treat all data sources equally. Instead, it continuously evaluates the reliability and accuracy of each source based on historical performance and cross-validation with other sources. This means a high-precision weather station might get a higher weighting for temperature data, while satellite imagery might be weighted higher for cloud cover or vegetation analysis.
What’s cool is that these weightings adjust automatically over time. If a particular data source starts showing inconsistencies or drifts from established patterns, the ESI reduces its influence in real-time. This adaptive approach allows us to maintain accuracy even when individual sources fail or degrade.
2. Multi-Dimensional Data Reconciliation
Environmental data exists in multiple dimensions — spatial (location), temporal (time), and parametric (what’s being measured). Most systems handle these dimensions separately, but the ESI reconciles them simultaneously using what I call “contextual integrity modeling.”
For example, if a sensor reports a sudden 15°F temperature spike in one location while surrounding areas show no change, traditional systems might either accept this outlier or reject it entirely. The ESI instead evaluates this reading against spatial, temporal, and physical constraints — Is this physically possible? Has this pattern occurred before? Do nearby sensors show any correlated changes? — and then makes an intelligent determination about how to incorporate this data point.
3. Temporal Bridging and Prediction
Different data sources update at different rates. Satellite data might come in once a day, IoT sensors might report every minute, and government weather stations typically update hourly. Instead of waiting for the slowest source or relying only on the fastest, the ESI creates a continuous temporal model that “bridges” between updates.
I developed a system that uses pattern recognition and physical modeling to predict how data points are likely to change between official updates. This means our users always see the most current estimate of conditions, even if the actual measurements haven’t been reported yet. When new data arrives, the model self-corrects and improves its future predictions.
4. Proprietary Edge Devices and Sensing Network
While the ESI works amazingly well with existing data sources, I’ve also designed a network of low-cost, high-efficiency sensor devices that can dramatically improve data density in areas where coverage is sparse. These devices use a fraction of the power of traditional weather stations but provide critical data points that enhance our overall model.
What makes our sensors unique is their adaptive sampling rate and mesh networking capabilities. Each device adjusts how frequently it samples based on:
- How rapidly conditions are changing
- How unique its readings are compared to nearby sensors
- Available power (many are solar-powered)
- Current network bandwidth
This approach lets us deploy sensors at a fraction of the cost of traditional networks while actually improving data quality where it matters most.
5. Continuous Machine Learning Integration
The most exciting aspect of the ESI is that it gets smarter every day. I built several machine learning systems that constantly analyze the relationships between different data sources, environmental factors, and actual outcomes. These systems identify patterns that would be impossible for human analysts to detect.
For example, our ML system recently discovered that a particular pattern of wind shifts in coastal areas preceded temperature changes by about 45 minutes — but only when specific atmospheric pressure conditions were present. This kind of insight improves our microclimate predictions and would have taken years for traditional meteorological analysis to discover.
The ML components don’t just improve predictions; they also help optimize our entire system, identifying which data sources provide the most value, where new sensors would be most beneficial, and how to allocate computational resources most effectively.
Technical Implementation: How We Built the ESI
Building the ESI required solving some fascinating technical challenges. Here’s a peek under the hood at the core technologies that make it possible:
Data Ingestion Architecture
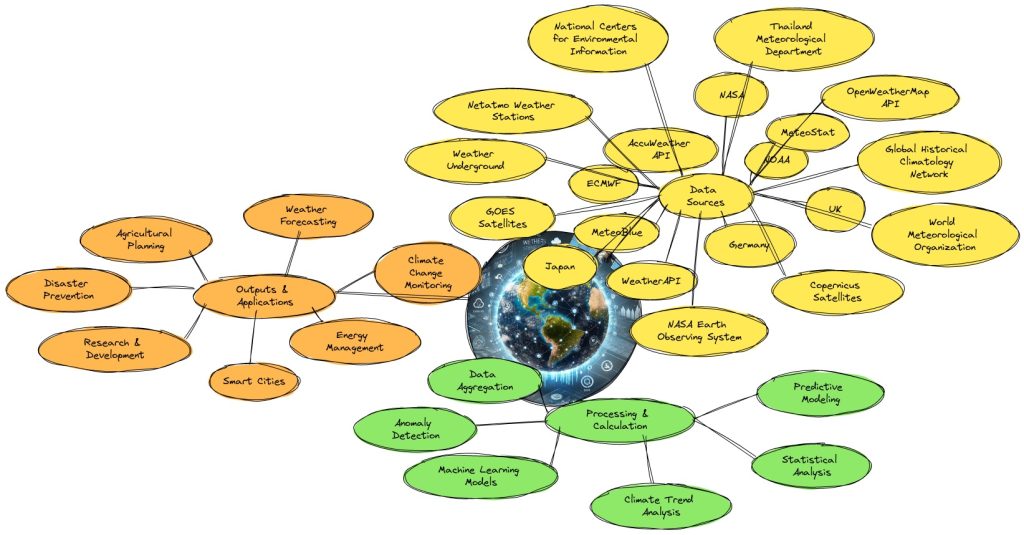
We’ve built a flexible ingestion system that can handle data from virtually any source:
- Public APIs from government weather services (NOAA, Met Office, etc.)
- Satellite and radar imagery from various providers
- IoT device networks and consumer weather stations
- Historical archives going back decades
- Our own proprietary sensor network
- Anonymized user reports and corrections
Each data source goes through a custom normalization pipeline that converts it to our unified data model while preserving source-specific metadata that helps with accuracy assessment.
Processing Pipeline
At the heart of the ESI is a multi-stage processing pipeline:
- Pre-processing and quality control: Automated filtering of obvious errors and anomalies
- Spatial interpolation: Creating continuous fields from discrete measurement points
- Temporal modeling: Developing continuous time series from irregular updates
- Physical constraint modeling: Ensuring data adheres to physical laws and relationships
- Multi-source reconciliation: Resolving conflicts between different data sources
- Confidence scoring: Assigning reliability metrics to each data point
- Output generation: Creating optimized data formats for different use cases
This pipeline runs continuously, with new data triggering targeted reprocessing rather than complete recalculation. This approach gives us near-real-time updates while keeping computational requirements manageable.
Machine Learning Components
The ESI integrates several ML systems:
- Source quality assessment: Models that evaluate the reliability of each data source over time
- Pattern detection: Systems that identify recurring patterns and relationships in environmental data
- Anomaly detection: Neural networks that flag unusual readings for further analysis
- Predictive modeling: Forecasting systems that predict how conditions will evolve between measurements
- Transfer learning: Applying patterns learned in data-rich areas to improve predictions in data-sparse regions
These ML systems operate both on historical archives (for training) and live data streams (for inference), creating a continuous feedback loop that improves accuracy over time.

Real-World Applications and Impact
The ESI’s capabilities extend far beyond just providing better weather data. Here are some applications we’re already developing:
Microclimate Optimization
By understanding hyperlocal environmental conditions, we can help users optimize everything from their commute route to their gardening schedule. Our early beta testers have reported significant quality-of-life improvements just from having access to accurate microclimate data.
Environmental Decision Support
For businesses and organizations, the ESI provides decision-critical environmental intelligence. A construction company can schedule work based on hyperlocal weather conditions at specific job sites. A fire department can deploy resources based on real-time fire risk assessments that incorporate dozens of variables.
Climate Research
The high-resolution, continuous data generated by the ESI creates unprecedented opportunities for climate research. We’re already working with academic partners who are using our data to study urban heat islands, coastal weather patterns, and the local impacts of climate change.
Smart Cities Integration
The ESI is designed to integrate with emerging smart city infrastructure. Imagine traffic systems that automatically adjust based on hyperlocal weather conditions, or public spaces that optimize irrigation based on microclimate data. We’re building the environmental intelligence layer that will power these systems.
The Path Forward: What’s Next for the ESI
While I’m incredibly proud of what we’ve built so far, this is just the beginning for the EarthScene Index. Here’s where we’re headed next:
Expansion of Data Sources
We’re continuously adding new data sources to the ESI, with a particular focus on incorporating novel sources that provide unique insights. These include acoustic sensors that can detect precipitation intensity, passive RF monitoring for atmospheric conditions, and even biometric data from plant sensors that respond to environmental changes.
API and Developer Ecosystem
We’re developing a comprehensive API that will allow developers to build on the ESI. This will create an ecosystem of applications across various industries, from agriculture to renewable energy to emergency management.
Advanced Predictive Capabilities
Our next generation of ML models will move beyond analyzing current and historical data to generating sophisticated environmental predictions. These won’t replace traditional weather forecasting but will complement it with hyperlocal, specialized predictions that traditional models can’t provide.
Global Expansion
While we’re starting with focused coverage in key regions, our architecture is designed for global scalability. Each region we add improves our overall system as our ML models identify patterns that apply across different geographies.
Intellectual Property and Competitive Advantage
The EarthScene Index represents a significant intellectual property asset. We’ve developed novel approaches in several areas:
- Dynamic data weighting algorithms that continuously optimize information value
- Temporal bridging methodologies that create continuous data from discrete measurements
- Edge computing architectures for environmental sensor networks
- Transfer learning techniques specific to geospatial environmental data
- Confidence scoring systems that quantify uncertainty in environmental data
Our patent strategy is focused on protecting the core methodologies while maintaining the flexibility to evolve the system. We believe the ESI gives us a fundamental competitive advantage that will be difficult for others to replicate, not just because of the technology itself but because of the continuous learning and improvement built into the system.
Join Us on This Journey
Building the EarthScene Index has been one of the most challenging and rewarding experiences of my life. What started as a personal project to better understand my local environment has evolved into a platform with the potential to transform how we interact with the world around us.
We’re looking for partners, beta testers, and investors who share our vision for environmental intelligence that’s accurate, accessible, and actionable. If you’re interested in being part of this journey, please reach out through our website or contact me directly.
I’ll be sharing more technical details about specific components of the ESI in future posts. What aspects would you like me to dive deeper into? Let me know in the comments!
– TM, Founder of EarthScene
Posted on March 4, 2025
The EarthScene Index (ESI) is an advanced environmental data processing system that integrates and normalizes multiple data sources to create a highly accurate and continuously improving environmental intelligence platform.
The ESI dynamically assigns weightings to different data sources based on their historical accuracy and real-time performance. It continuously adjusts these weightings to prioritize the most reliable sources.
Unlike traditional data aggregators, the ESI uses machine learning, temporal bridging, and multi-dimensional reconciliation to create a “living mesh” of environmental intelligence that self-corrects and improves over time.
The ESI applies contextual integrity modeling to evaluate each data point against physical, spatial, and temporal constraints. It determines the most reliable interpretation by cross-referencing with multiple sources.
Yes! The ESI integrates real-time sensor networks and IoT data while applying predictive modeling to fill gaps between updates, ensuring a continuously available and accurate dataset.
The ESI can be used for microclimate analysis, environmental monitoring, climate research, disaster response planning, agriculture optimization, and smart city integration.
No, the ESI can work with existing weather stations, IoT devices, and satellite data. However, EarthScene also develops proprietary low-power sensors to enhance data coverage in areas with limited infrastructure.
The ESI uses pattern recognition, physical modeling, and machine learning to anticipate environmental shifts. It bridges data gaps by predicting likely changes based on historical trends and real-time inputs.
Yes! EarthScene is developing an API that will allow developers to integrate ESI data into applications for research, agriculture, city planning, and more.
You can join as a beta tester, partner with us for research, or contribute to the development of our sensor network. Visit our website for more details on collaboration opportunities.